Start Here: The Safe Default
AI can help explain a complicated workbook, suggest a formula, draft a chart, or identify a pattern worth investigating. It can also turn a routine analysis into an unintended disclosure. A workbook may contain more than the visible cells: hidden sheets, comments, names, formulas, author details, linked sources, and rows that identify real people even after names have been removed.
The safest starting point is not “Which chatbot should I upload this to?” It is “Can this task be done with less data, and is this exact tool approved for what remains?” If the answer is unclear, do not upload the original. First make a separate working copy, remove information that is unnecessary, and test your analysis with invented or aggregated data.
This guide gives you a repeatable workflow for individual projects and small teams. It does not promise that any particular AI service is private, certify a provider, or replace legal, compliance, or security review. Product terms differ by account type, region, feature, and date. Verify the policy that applies to the tool you will actually use, not a general marketing page or a setting you remember seeing last year.
If a workbook contains credentials, regulated records, confidential customer information, employee data, or material covered by a contract, pause. Ask your data owner or security/privacy contact whether the specific service and workflow are approved. If you cannot get an answer, keep the data in an approved system and use a synthetic example to get help with the method instead.
In one sentence: minimize the data, authorize the destination, and independently reproduce the result.
What This Guide Covers
We will walk through a simple scenario: a small organization wants to understand monthly support requests and their resolution time. Its workbook contains dates, regions, issue categories, customer names, email addresses, account notes, and a few unusual cases. The goal is to identify workload patterns, not to learn anything about an individual customer.
That difference matters. The analysis may need month, broad region, issue category, and a duration measure. It probably does not need names, emails, exact free-text notes, account numbers, or precise timestamps. The first privacy control is therefore not a clever prompt. It is deciding which fields the analysis actually requires and leaving the rest behind.
The same approach applies to budgets, sales exports, survey results, school data, project trackers, inventory lists, and operational reports. The examples use fictional values. They are not benchmarks, measurements of AI accuracy, or claims about a particular provider.
You will learn to:
- Decide whether the data and task are appropriate for AI assistance.
- Inspect the workbook for visible and hidden information.
- Choose among a local tool, an approved organizational tool, synthetic data, or ordinary spreadsheet features.
- Prepare a minimized copy and document what changed.
- Ask focused, testable questions rather than handing the model a vague mandate.
- Verify formulas, summaries, charts, and recommendations before using them.
- Set team rules for access, retention, review, and incident response.
The method is intentionally cautious without being anti-AI. If the workbook is low-risk and the tool is approved, a carefully scoped analysis can be useful. If the information is sensitive or the tool's data handling is unclear, there are still productive options: build a synthetic sample, ask for a formula pattern, aggregate locally, or use a locally approved model.
The Core Trade-Off: Useful Context Versus Unnecessary Disclosure
A model can only analyze the information it receives. More relevant context can improve an answer, but “more data” is not automatically “better context.” Supplying every column, row, comment, and worksheet expands exposure and can make the model focus on details unrelated to the question.
Think of a spreadsheet as a package of information with multiple layers:
- Values: names, dates, amounts, categories, IDs, and free-text fields.
- Structure: sheet names, column headings, named ranges, formulas, filters, and relationships between tables.
- History and metadata: comments, tracked edits, authorship, document properties, cached values, and external links.
- Inference: facts that can be deduced by combining fields, such as identifying a person from a rare role, small town, and unusual event date.
- Access context: who owns the file, where it is stored, which account is signed in, and what the AI integration can read beyond the current sheet.
An upload, paste, connected-app permission, or AI side-panel request may transmit content to a service. The mechanics vary, but the operational rule is stable: treat information provided to a hosted tool as disclosed to that provider under the applicable terms. Turning off model training, if a setting exists, does not mean that no processing or retention occurs. Enterprise contracts can provide different protections from personal accounts, but the name of a product tier is not a substitute for reading its terms and your organization's agreement.
There is also a quality trade-off. A model may make an incorrect assumption when context is missing; supplying an entire workbook to avoid that risk may expose far more data than the task needs. A better compromise is a small, synthetic sample that preserves the relevant column types, relationships, and edge cases without preserving real identities or confidential values.
A Data-Minimization Decision Chart
Use this chart before selecting a tool. “Lower risk” is not a guarantee, and classification rules should come from your organization or applicable law—not from this example.
| Data situation | Example | Safer default | AI assistance that may fit |
|---|---|---|---|
| Public or invented data | Public weather figures; made-up sales rows | Still avoid secrets in prompts; check terms | Hosted tool may be suitable for explanation, formula drafting, or chart ideas |
| Internal but non-sensitive | General inventory counts; broad project status | Use an organization-approved account and share only needed columns | Approved cloud tool or a sanctioned local tool |
| Personal or confidential | Customer emails, employee records, contract rates | Do not use a consumer service; ask the data owner and privacy/security team | Approved enterprise workflow with documented scope, or local analysis if authorized |
| Regulated, highly sensitive, or credential-bearing | Health records, payment data, government IDs, passwords, API keys | Do not upload unless a documented, explicitly approved process permits it | Specialized environment with appropriate controls, or no AI tool |
| Unclear classification or unclear provider terms | Unknown export, unclear account, unverified plugin | Stop and clarify; use synthetic data meanwhile | Ask about the method without sharing the source workbook |
This chart is a screening aid, not a legal classification scheme. A row with no name can still be personal data if a person is identifiable by context. A dataset that is public can still contain a sensitive secret accidentally. Review the actual content and the purpose of the analysis.
Step 1: State the Question Before Opening an AI Tool
Write a one-sentence analysis question and list the minimum outputs you need. This prevents a common failure mode: uploading a workbook and asking “What do you see?” A broad request encourages the model to inspect everything, invent a narrative, and surface patterns that may be irrelevant or privacy-invasive.
For the support example, a good question is: “For each calendar month, what is the median resolution time by broad issue category, and how many records contribute to each result?” That question requires a date bucket, category, and duration. It does not require a customer's name, email address, exact message, or account history.
Turn the question into a compact specification:
- Purpose: understand staffing needs, not evaluate individual workers or customers.
- Population: support requests received in the last six complete months.
- Measures: count of requests and median elapsed hours to close.
- Grouping: month and broad issue category.
- Exclusions: test records, duplicates, and still-open cases, with each exclusion recorded.
- Output: a summary table, a chart, and a note about limitations.
- Decision boundary: findings inform a staffing discussion; they do not automatically set schedules or assess employees.
This short specification does two jobs. It limits what the AI needs, and it gives you something concrete to verify. If you cannot say what decision the analysis supports, do not grant an AI tool broad access while you figure it out.
Step 2: Classify the Workbook and Its Intended Use
Classify both the data and the decision. The same spreadsheet may be low-risk for a broad operational count and high-risk for a decision about an individual. A payroll workbook used to calculate an anonymized quarterly total is different from asking a model to rank employees by performance.
Ask the data owner or yourself, if you are authorized:
- Who is represented? Customers, patients, students, employees, contractors, or the general public?
- Could the analysis affect them? Could it influence access, pay, eligibility, treatment, reputation, or an important opportunity?
- What commitments apply? Privacy notices, client contracts, data-processing agreements, retention schedules, research consent, or company policy?
- Who can authorize the use? The person who can open the workbook may not be the person empowered to approve a new processing purpose.
- What is the destination? Consumer chatbot, organization-managed account, spreadsheet-integrated assistant, API, local model, plugin, or third-party add-on?
- What does the account actually provide? Data-use terms, retention limits, administrative controls, audit logs, access restrictions, and a documented deletion process.
- Can the task be done without row-level data? A pivot table or grouped export may answer the question with less risk.
If a contract, law, policy, or data owner says the information cannot go to that service, that is the decision. Do not try to turn prohibited data into “anonymous enough” by deleting a name column and uploading it anyway. For uncertain or high-impact decisions, consult qualified privacy, legal, compliance, or security staff before proceeding.
Step 3: Choose the Lowest-Exposure Route That Can Do the Job
There are several ways to get help; they are not interchangeable. Start with ordinary spreadsheet features. A pivot table, formula, built-in chart, or query may solve the problem without sending data to an AI system at all. If you need help writing the formula, ask about it with fabricated column headings and sample rows.
Route A: No external AI
Use the spreadsheet program's built-in tools, a documented query, or a small script running in an approved environment. This is often the simplest route for sums, counts, deduplication, and grouping. It also makes the calculation easier to repeat. You can still ask an AI to explain the method using fictional data.
Route B: Synthetic or aggregated data
Create a representative sample that preserves the shape of the problem but not the actual people or confidential values. Replace names with invented labels, change dates, alter amounts, and construct edge cases deliberately. Better still, share only aggregate counts or summary statistics where that is enough to discuss the next step.
Synthetic does not mean “scrubbed real rows.” Replacing a real customer's name with “Customer 17” while leaving the exact town, rare product, event time, and note may leave the person identifiable. Generate new rows rather than transforming a small set of real rows when feasible.
Route C: An approved organization-managed service
An organization-managed AI service may have contractual protections or administrative controls that a consumer account does not. Check the product name, edition, account identity, and feature: a company may approve an AI assistant in one workspace but not a similarly branded consumer website or browser extension. Confirm data use, retention, training, human access, regional processing, connected-app permissions, and deletion.
Route D: A local model or local analysis tool
A model running on your device can reduce transmission to a hosted model, but the word “local” needs verification. Some desktop apps send prompts to cloud endpoints; extensions may have their own telemetry; model downloads can include third-party code; and a synced folder can upload the workbook elsewhere. Confirm where inference occurs, what network access is enabled, who maintains the software, and whether your organization's endpoint controls permit it.
Local processing is not an automatic compliance exemption. The device can be lost, compromised, backed up to an unapproved service, or accessed by another user. Apply the same data classification, access, retention, and output-validation rules.
Step 4: Inspect the Workbook—Not Just the Visible Table
Before creating a shareable copy, inventory its contents. Spreadsheet applications differ, so consult the application's current documentation for the exact menus and file-format behavior. The checks below are general inspection goals, not a claim that a single “remove hidden data” command covers every format.
Visible sheets, rows, and columns
Review every worksheet, including tabs hidden from ordinary view. Look beyond the current filter: filtered-out rows still exist in the workbook. Inspect grouped or collapsed rows, columns beyond the visible table, and cells far below or to the right of the apparent dataset. Search for names, addresses, phone numbers, email addresses, employee IDs, account numbers, secrets, and notes.
Comments, notes, and document properties
Comments and annotations may quote private conversations or reveal who made a decision. Author and company metadata can identify a person or organization. Document properties can also disclose a project name, customer, or internal directory path. A file that looks clean in the grid may still include these fields.
Hidden sheets, named ranges, and formulas
Hidden sheets often contain lookup tables, raw records, draft calculations, or intermediate values. Named ranges can point to cells that are not obvious. Formulas may reveal business logic, internal identifiers, external workbook paths, or confidential assumptions. Some formats store cached formula results alongside formulas, and a converted export can behave differently from the original workbook.
External links, connections, and embedded content
Check for linked workbooks, data connections, embedded objects, macros, and add-ins. Do not enable a macro or external content merely to inspect a file you did not create. If the workbook came from an untrusted source, follow your organization's safe file-handling procedure before opening it. A prompt to “enable content” is not a routine privacy step.
Filters, pivots, and data-model leftovers
Pivot caches and saved filters may retain data not visible in the current report. A pivot table with a handful of visible totals may still have a cache containing source records. Data models and query connections may also carry the underlying information. Exporting the visible range as a new values-only CSV can remove some workbook structure, but it does not automatically anonymize the values or guarantee that the export contains only the rows you intend.
A practical review sequence
- Keep the original in its approved storage location; do not overwrite it.
- Make a clearly named working copy in a location approved for the data class.
- Inspect each sheet and the workbook's document properties.
- Search relevant identifier patterns and scan free-text fields.
- Check for hidden rows/columns/sheets, comments, links, formulas, and caches.
- Decide which columns are required for the stated purpose.
- Create a new minimized export rather than trying to “clean” the original in place.
- Reopen the export in a fresh session and confirm the visible contents match the intended scope.
For sensitive workbooks, use your organization's approved discovery or data-loss-prevention tools. Manual inspection can miss fields, special formats, and hidden content.
Step 5: Remove or Transform What the Question Does Not Need
Minimization is more reliable than broad redaction. If the analysis is about monthly workload, remove direct identifiers entirely rather than leaving empty columns for the AI to encounter. If it needs a category, keep a broad category and remove the customer narrative. If it needs elapsed time, keep duration and remove exact start and end timestamps.
Direct identifiers
Names, personal email addresses, phone numbers, street addresses, account IDs, government identifiers, payment information, and credentials are obvious removal candidates. Credentials should not be shared even as a “small example.” If a secret was pasted into an unapproved service, follow the relevant incident process; rotate it as directed by your security team rather than assuming deletion from the chat instantly removes every copy.
Indirect identifiers and combinations
A combination can identify someone even when each field looks ordinary. Consider a dataset with broad job title, small town, exact date, and a rare case type. A public announcement or a colleague's knowledge may make the row obvious. Review the combination, not just each field independently.
Free text and narrative columns
Free-text notes are often the riskiest field because authors include names, sensitive circumstances, contact details, and quotes in inconsistent ways. Keyword replacement is brittle: a name may appear in a nickname, typo, file path, or sentence that still identifies the person. If the task does not require the text, remove it. If it does, use a documented redaction process, review the result, and get approval before any external transfer.
Dates and locations
Exact timestamps and small geographic units can make rare events easy to identify. Aggregate dates to month or quarter, and generalize locations to a larger region when the analysis allows it. If the exact day is essential to detect a system incident, ask whether a limited, approved environment can perform that analysis without disclosing the underlying identities.
Amounts, rare values, and small groups
Unusual amounts or one-person groups can be identifying. Round or band values when precision is not needed, combine categories, and suppress small groups in outputs. A public chart with a single count in a small town can expose a person's record even if the uploaded dataset never leaves the analyst's account.
Pseudonyms are not anonymity
Replacing names with random IDs may help keep a workflow organized, but it is pseudonymization: the records may still be linked to a person using other data or a separate key. Keep any re-identification key separately, with stricter access, and do not send it with the analysis file. Never call a dataset anonymous merely because names were replaced.
Consider whether transformation itself preserves the task
Over-redaction can destroy the pattern you need. If timing matters, randomizing every date may make seasonality impossible to study. If region matters, replacing every location with the same label removes the comparison. Choose a transformation that preserves the analytic property while reducing specificity, then test it against a synthetic dataset. If you cannot explain what the transformation preserves and what it loses, do not claim the result represents the original data.
A Spreadsheet Example: From Raw Export to Minimal Working Set
Imagine the original support workbook has these fields:
| Original field | Keep for the stated question? | Safer handling |
|---|---|---|
| Customer full name | No | Remove |
| Personal email address | No | Remove |
| Account number | No | Remove |
| Exact message text | No | Remove; it may contain sensitive details |
| Exact opened timestamp | Usually no | Convert to month; preserve exact timing only if approved and necessary |
| Exact closed timestamp | Usually no | Calculate elapsed hours inside the approved system, then remove source timestamps |
| Issue category | Yes, if broad enough | Merge rare categories and document the mapping |
| Broad region | Maybe | Keep only if it supports a legitimate comparison and groups are sufficiently large |
| Resolution duration | Yes | Calculate locally; check for negative or implausible values |
| Test-record flag | Yes, for exclusion | Keep only the flag needed to filter test data |
| Internal agent name | No for workload trends | Remove; do not turn aggregate analysis into employee ranking |
The example result might contain only four columns: month, broad issue category, region band, and elapsed-hours band. Whether even those columns are appropriate depends on the data, group sizes, purpose, and tool. A row with an exact event month, rare category, and small region could still be identifying. Minimize further if that combination is unusual.
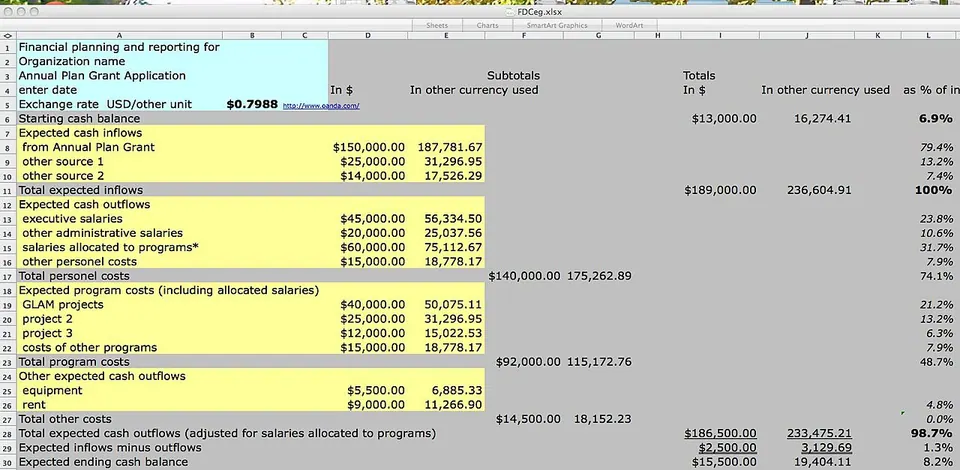
A separate, public-domain budgeting worksheet example—not the fictional support data in this guide. Source and CC0 license.
The safe copy should be a new file, with a clear owner and purpose. Avoid naming it with a customer's name or case reference. Do not put a re-identification key in the same folder or share it with the model. Keep the original under the existing retention and access rules.
Step 6: Choose What to Share—A Prompt, a Sample, or a Summary
There are at least four levels of context, from least to most revealing:
- Method-only question: column types and desired output, no actual rows.
- Synthetic sample: invented rows that mimic format and edge cases.
- Aggregated result: totals or grouped values already computed in an approved environment.
- Minimized row-level data: only if required, authorized, and permitted by the destination.
Choose the lowest level that can answer the question. To ask for an Excel or Google Sheets formula, you often need only application name, version if relevant, generic headers, expected output, and two or three invented examples. To interpret a real pattern, an aggregate table may be sufficient. Full row-level data should be the last resort, not the default.
Avoid uploading the original workbook simply because the product can “read files.” File-reading features make it convenient to provide context; convenience does not establish authorization. Likewise, granting a spreadsheet connector permission to access an entire drive can be broader than granting it access to one approved file. Review the exact scope and revoke permissions when no longer needed.
Step 7: Prepare a Safe Working Copy
Use a controlled sequence rather than a last-minute manual cleanup:
1. Preserve and label the source
Keep the original unchanged, in the authorized storage system. Record a neutral working-copy name, the data owner, purpose, date of preparation, and classification. Do not copy the workbook to a personal downloads folder if policy forbids it.
2. Create the minimized dataset
Use an approved spreadsheet operation, query, or script to select the necessary columns and transform fields. Prefer explicit selection (“include these four columns”) over trying to discover every prohibited item (“delete anything sensitive”). If possible, write a short reproducible script or query so the same transformation can be rerun and reviewed.
3. Use invented examples for model guidance
For help with formulas or methods, create a separate synthetic file with fictional labels and plausible edge cases. Make the sample visibly synthetic, for example by using names such as “Example A” and dates in a clearly fictitious period. Do not disguise actual rows as synthetic with small substitutions.
4. Inspect the new file
Open the copy and check sheet names, rows, columns, comments, formulas, hidden content, file properties, links, and output. Confirm there are no unexpected identifiers or confidential values. A CSV usually carries less workbook metadata than an Excel workbook, but it can still contain sensitive cell values, formulas saved as text, and malformed rows.
5. Confirm the destination
Check that you are signed into the intended account. Confirm the product and feature are the approved ones, not a personal account in another browser profile. Review connected-app permissions and sharing settings. If using a local tool, verify that “local” is real for the current configuration and that network services are not silently enabled.
6. Record the disclosure decision
For a personal low-risk task, a brief note may be enough: tool, data level, purpose, and date. For organizational or regulated data, follow the formal approval and logging process. Do not invent an informal spreadsheet of sensitive prompts if policy says not to retain them; document the workflow in the approved system.
7. Upload only when all checks pass
If the tool, account, data, and purpose are not all approved, stop. Use the synthetic workflow or perform the calculation locally. No deadline or productivity gain justifies bypassing a required control.
Step 8: Understand the Specific AI Service and Account
Terms and controls are product-specific and can change. Read the documents for the precise service, account type, and feature you will use. A browser chatbot, API, enterprise workspace, spreadsheet add-in, and extension may have different data flows even when they share a brand.
Check these items, preferably in writing:
- Training and product improvement: Is content used to train or improve models? Is an opt-out available? Does it apply to this account and feature?
- Retention: How long are prompts, files, outputs, logs, and abuse-monitoring records retained? Does deleting a chat delete the uploaded file and associated logs?
- Human access: Under what circumstances can employees or contractors inspect content? Is support access logged and restricted?
- Subprocessors: Which cloud, analytics, or support providers may process content?
- Location: Where may data be stored or processed? Does a residency commitment cover prompts and logs, not just the primary file?
- Connected-app permissions: Can the assistant search other documents, emails, or drives? Is access scoped to one file or broad by default?
- Sharing and training settings: Which settings are controlled by the user, administrator, or organization? Are defaults different for personal accounts?
- Deletion: What is the deletion timeline, and what exclusions apply for backups, legal holds, or security logs?
- Contract: Does the agreement cover the relevant data type, purpose, and use? Are terms available for your geography and account?
- Output rights and restrictions: Are there restrictions on uploading copyrighted or client-owned material? Who can access outputs?
- Incident process: Who do you notify if sensitive information is uploaded by mistake?
Do not rely on a screenshot, marketing claim, forum answer, or old memory. Save the official policy references and date checked if your process requires evidence. If terms are ambiguous, ask the provider or internal owner; ambiguity is not approval.
Step 9: Write a Prompt That Limits Scope and Makes Errors Visible
A good spreadsheet prompt describes the task, data shape, expected output, assumptions, and tests. It does not need names or a dramatic “expert persona.” Set a hard boundary: use only the supplied synthetic or approved data, do not infer individual characteristics, and label unsupported conclusions as unknown.
Formula request template
I am using [spreadsheet application and version]. I have a table with these synthetic columns:
Month,Category, andHoursToClose. I need a formula that returns the median hours by month and category, ignoring blank duration cells. Explain each range reference, state any assumptions about the table layout, and provide three test cases: a blank value, a single row, and two rows with different durations. Do not use external data. If the formula depends on a feature unavailable in my version, offer a compatible alternative.
Data-quality request template
Review this invented sample and suggest checks for inconsistent categories, duplicate rows, missing values, negative durations, and dates outside the reporting period. Do not classify individual people or infer causes. Return a checklist with a spreadsheet formula or query for each check, plus the expected output for the sample. Clearly label any assumption.
Aggregated-pattern request template
The following table contains aggregate counts by quarter and broad category. Explain which comparisons are supported and which are not. Do not claim causation. Mention small denominators, missing periods, changes in category definitions, or other limitations that could change the interpretation. Use only the table. For each observation, cite the cells or values it relies on.
Chart request template
Suggest a chart for these synthetic monthly counts. State what comparison the chart makes easy, what it hides, and which axis labels and units are needed. Do not invent data, trend lines, or significance tests. Provide a reproducible spreadsheet setup using the values shown.
Prompt boundaries worth including
For sensitive or high-impact work, add explicit constraints: do not identify people, do not recommend employment, eligibility, medical, or credit decisions, do not extrapolate beyond the supplied period, and do not treat correlation as causation. Ask for evidence references (sheet, row, or cell) when appropriate, but remember that a model can fabricate cell references. Confirm them in the source application.
Avoid asking the model to “find who is underperforming,” “identify suspicious customers,” or “decide which applications deserve approval.” Those requests turn a data summary into a consequential judgment. If a legitimate process requires such a decision, use approved decision systems, validated criteria, human accountability, and applicable review—not an unvalidated chatbot answer.
Step 10: Work in Small, Reproducible Stages
Instead of one all-purpose prompt, split the analysis into small steps. Each response should be testable before you build on it.
Stage A: Confirm structure
Ask the model to restate the column names, units, date range, and missing-value conventions from your synthetic sample. Correct any misunderstanding before asking for calculations. Do not interpret this restatement as proof that it parsed a real workbook correctly.
Stage B: Identify data-quality checks
Ask for checks, not conclusions. Examples include duplicate keys, invalid dates, blank categories, negative durations, impossible values, and categories that changed spelling. Run the checks locally and record the number of flagged rows.
Stage C: Define the calculation
Specify the unit, grouping, denominator, exclusions, and treatment of nulls. “Average response time” is ambiguous: it could mean arithmetic mean, median, business hours, calendar hours, first response, or time to final resolution. Define it before asking for a formula.
Stage D: Generate a method
Ask for a formula, pivot-table setup, or script on synthetic rows. Request a clear explanation, assumptions, and edge-case tests. Keep any production execution within the environment approved for the source data.
Stage E: Reproduce the calculation
Run the formula or query yourself, ideally in a fresh copy or independently implemented method. Compare several sample rows by hand. Check the total row counts before and after filtering, grouping, and exclusions.
Stage F: Ask for interpretation
Give the model only the approved result table. Ask it to separate descriptive observations from hypotheses, and to list other explanations. Treat suggested causes as questions for investigation, not evidence.
Stage G: Create a chart
Use the spreadsheet application's charting tool or a reviewed code path. Check the axis units, period ordering, missing values, denominator, and category mapping. Do not rely on a model-generated chart image without verifying its data points and scale.
Stage H: Review the final output
Check whether the output includes confidential values copied back from context, unsupported claims, or accidental identifiers. Ensure that the chart and narrative match the verified calculations. Remove temporary uploads according to the service's documented process and your organization's retention rules.
This staged approach is often faster than asking for a complete report, because errors become easier to isolate. If the model changes a formula, you know which step changed. If its narrative conflicts with the table, the conflict is visible before the narrative is forwarded.
Worked Example: From Messy Request to Reviewed Summary
This walkthrough uses only invented values. It illustrates how to make decisions; it is not an experiment and does not measure any chatbot's accuracy.
The initial request
A team lead says: “I have a customer-support workbook. Can you upload it to AI and ask what our agents are doing wrong?” That request combines a vague purpose, likely personal information, and an individual-performance inference. The analyst does not upload anything. Instead, they ask what business question needs answering.
After discussion, the real need becomes: “We need to decide whether to schedule more general support coverage in the spring. Do the median resolution times for broad request categories change month by month?” The decision is about aggregate staffing needs, not ranking agents. The team documents the reporting period, the three broad categories, and the fact that the result is descriptive.
The source workbook
The original workbook has 600 rows across three sheets. One sheet contains customer names, emails, case narratives, exact timestamps, category, agent name, status, and resolution duration. A second sheet has a lookup list, including a few rare categories. A third contains a pivot table and a cached copy of the source data. The workbook also has comments from a manager.
The analyst confirms that the workbook is internal and asks the data owner which service can process it. While approval is pending, no file is sent. The analyst instead prepares a synthetic example and gets help with a proposed summary method. The manager agrees that names, messages, agent names, and exact timestamps are not needed for the staffing question.
The synthetic test set
To check the method, the analyst creates six invented January rows. Each is a made-up record, with no copied values from an actual customer:
| Example row | Broad category | Synthetic hours to close |
|---|---|---|
| A1 | Account access | 4 |
| A2 | Account access | 6 |
| B1 | Billing question | 6 |
| B2 | Billing question | 8 |
| S1 | Setup help | 9 |
| S2 | Setup help | 11 |
The median for each pair is easy to check by hand: 5 hours for account access, 7 for billing, and 10 for setup. The analyst includes a blank duration and a duplicate row in a second test version to verify how the method treats missing values and duplicates. They do not silently drop either case: the analysis specification says whether each is excluded, counted, or separately reported.
The approved preparation
The organization confirms which account and analysis feature are approved, and under what data classification. The analyst makes a new working copy in the approved location, selects only the required data, and calculates elapsed hours there. They remove customer and agent names, email, message text, exact timestamps, account numbers, and unnecessary free text. They review rare categories and map them into broader labels with the data owner's approval.
The analyst inspects the output file rather than assuming the export is clean. It has one worksheet and four columns: month, broad category, broad region, and elapsed hours. The hidden sheet, comments, names, external connections, and document properties from the original are not in the new file. The row count is recorded before and after each documented exclusion; the new file is not described as anonymous.
The bounded analysis
The prompt asks for median hours to close by month and broad category, with the number of cases in each group. It specifies the treatment of open cases, missing durations, and test records. It prohibits individual ranking, causal claims, and external data. The assistant suggests a grouping and formula approach on the synthetic sample first.
The analyst tests the suggested formula on the six invented rows and confirms the three known medians. They then check the formula against boundary dates, empty cells, a single-row category, and duplicate handling. Only after these checks does the analyst run the reviewed method against the approved working copy, inside the authorized workflow.
The result and its limits
The summary table contains monthly medians and group sizes. The analyst checks that each monthly group count matches the source rows after exclusions, that all categories use the same mapping, and that no missing month has been filled in by the model. A second reviewer independently reproduces one month and checks the formula range.
The AI proposes a sentence that “a staffing gap caused slower setup resolution.” The analyst rejects the causal wording: the table contains only category and time, not staffing levels, case complexity, or a causal study design. The final text says only that the synthetic example's median setup duration differs by month, and that the workbook alone does not explain why.
The report contains the verified table and a clearly labeled chart. It omits agent names and small-group details, identifies the period and metric, and states that the analysis informs a planning discussion rather than automatically assigning shifts. The source file remains in its original approved location. The temporary working copy, prompt, and output follow the organization's retention rule.
What this example demonstrates
The safety came from multiple steps: clarifying the purpose, refusing an unnecessary individual evaluation, using synthetic rows for formula guidance, checking hidden workbook content, confirming the approved service, limiting columns, testing the calculation, and reviewing the narrative. No single step—anonymization, a privacy toggle, a prompt instruction, or a chart—would have delivered the same protection on its own.
If approval had been denied or the data owner could not confirm the provider terms, the method would still have worked: calculate the group summary in the approved spreadsheet environment and ask for help only with synthetic values. If small groups made the output identifying, aggregate further or do not publish that comparison. If the result were to affect individual workers, the original purpose would need a separate review rather than quietly extending this analysis.
How to Decide Whether AI Adds Enough Value
AI should earn its place in the workflow. Compare the proposed use with a conventional spreadsheet method across five questions: necessity, data exposure, repeatability, review effort, and impact.
| Task | Usually simplest first step | AI can help with | Extra checks |
|---|---|---|---|
| Sum, count, or filter a clean table | Built-in formula or pivot table | Explaining syntax on invented rows | Verify range, blanks, filters, and totals |
| Write an unfamiliar formula | Official application help and a synthetic test | Drafting a candidate formula and edge cases | Test against known outputs and app version |
| Standardize category names | Reviewed mapping table or query | Suggesting candidate mappings from synthetic examples | Human approval; preserve the source and audit each mapping |
| Find duplicates or invalid values | Conditional formatting, query, or validation rules | Suggesting possible quality checks | Confirm what defines a duplicate; inspect flagged examples |
| Summarize a very large workbook | Approved query or analytics environment | Explaining a schema or helping draft a query | Permissions, query correctness, sampled reconciliation |
| Explain an aggregate pattern | Chart and domain review | Listing alternative explanations and limitations | Separate observation from hypothesis; check small groups |
| Rank people or decide eligibility | Established accountable process | Usually not an appropriate general-chatbot task | Formal policy, validation, legal/privacy review, human accountability |
If a spreadsheet function can solve a deterministic task in one checked step, it may be safer and faster than an AI conversation. If you need help understanding a new formula, AI can provide a first draft, but the formula must still be tested. For data cleanup, a deterministic mapping can be easier to audit than asking a model to transform every row.
Consider the total cost of review, not only the time to obtain an answer. If it takes longer to determine whether an AI-generated formula or explanation is correct than to calculate the result directly, the tool has not saved time. For recurring work, compare the ongoing cost of prompts, review, logging, and policy maintenance with a documented query or template.
Also consider whether a model is the right interface. A connected assistant may be convenient but require broad file access; a local script may be less conversational but more reproducible; a pivot table may be transparent to a second reviewer. The most useful tool is the one that achieves the stated purpose with authorized access and an output you can explain.
Do not adopt a workflow merely because the provider offers a “data analysis” button or the workbook contains many rows. A large dataset does not justify sending it to a new service, and a feature's ability to produce a chart does not establish the correctness of the calculation. Start with the task and constraints, then choose the tool.
Step 11: Verify Formula and Data Results
Never paste a generated formula into a production workbook and assume it is correct. A plausible formula can be wrong because of range boundaries, locale-specific separators, date systems, text-versus-number fields, blank cells, hidden rows, duplicate records, or a function unavailable in your application's version.
Use a small test set with known answers
Construct a synthetic miniature table where you can calculate the answer by hand. Include:
- A normal row.
- A blank or missing value.
- A duplicate row.
- A boundary date at the start or end of the period.
- A zero value and a negative value if the domain permits or needs to reject them.
- A category with one record.
- A category with several records and a known median or average.
- Text that resembles a number, such as
"12"rather than numeric12.
Run the AI's formula on this test set. Compare the output to your hand calculation. If the formula behaves differently than expected, ask the model to explain the specific test failure, then run the revised formula against the entire test set again.
Verify row counts at each transformation
Record the number of source rows, rows excluded as tests or duplicates, rows with missing values, rows included in the analysis, and output rows per group. Counts should reconcile. For example, if you exclude 12 test records and 3 duplicate records from 500 source rows, the expected remainder is 485 only if those sets do not overlap. If overlap exists, calculate the union rather than subtracting both counts blindly.
Check the denominator
Percentages and rates can look correct while using the wrong denominator. Does the rate use all rows, only closed cases, or only cases with a nonmissing duration? Are groups being compared against different population sizes? Ask for the numerator and denominator separately; reproduce both.
Watch for spreadsheet date traps
Dates may be stored as serial numbers, strings, local times, or UTC timestamps. Spreadsheet applications may use different date systems or locale conventions. A formula that groups a date by month can silently fail for text-formatted dates. Inspect the cell type and compare boundary cases, daylight-saving transitions, and timestamps near midnight where relevant.
Validate statistical summaries
Mean, median, percentile, and trimmed mean answer different questions. A few extreme values can pull the mean. The median can hide a long tail. A percentile depends on the chosen method, especially for small samples. Show the sample size and spread alongside a central estimate where useful. Never present a single average as if it describes every person or case.
Check for selection and missingness
Missing records may not be random. A system outage, a changed intake form, or a workflow migration can create a gap in precisely the period being compared. Ask what records are absent and why. If the missingness is systematic, a clean-looking chart may tell a misleading story.
Compare independent methods
For important decisions, calculate the core result with a second method: a pivot table and a formula, a spreadsheet and a reviewed script, or an independent sample calculation. The methods should be sufficiently independent that they are unlikely to reproduce the same mistake. Re-running the same generated code twice is not independent verification.
Keep a result-to-source trail
For each reported number, retain enough approved documentation to trace it to the version of the working dataset, transformation, formula or query, and validation check. Do not include sensitive row details in a public report just to make it “auditable.” Internal audit trails should themselves follow access and retention requirements.
Step 12: Distinguish Description, Prediction, and Causation
AI often turns a difference in a table into a confident explanation. Keep three kinds of statement separate:
- Description: “The median reported duration was higher in quarter two than in quarter one.”
- Prediction: “If the observed pattern continues, next quarter may have a higher median duration.” This requires a forecasting method and uncertainty analysis.
- Causal claim: “The staffing change caused the duration to increase.” This needs a design that can support causal inference and must rule out plausible alternatives.
A spreadsheet correlation does not show that one factor caused another. A model-generated paragraph can make a hypothesis sound like a fact by writing it smoothly. Ask the model to label statements as observation, hypothesis, or unknown, and then check every statement against the source data and study design.
Before sharing a narrative, ask:
- Is the wording descriptive or causal?
- Does every number match a reproducible calculation?
- Is the time period complete and comparable?
- Did category definitions or collection practices change?
- Are there small groups or missing records?
- Could the pattern be driven by a few outliers?
- Does the narrative imply a judgment about a person?
- What alternative explanation would also fit the observed values?
If the answer would influence hiring, pay, promotion, school placement, credit, health, housing, or access to essential services, stop and use the organization's established process with qualified human oversight. A chatbot's explanation is not a validated decision procedure.
Step 13: Use Charts as a Verification Surface
A chart is not decoration. It can reveal an incorrect aggregation, a missing month, a denominator mismatch, or an axis that exaggerates a small difference. It can also hide the same problems if the display is poorly chosen.
For the fictional support example, suppose a verified synthetic summary shows median hours to resolution by broad category. The values below are invented only to demonstrate chart selection:
| Month | Account access (median hours) | Billing question (median hours) | Setup help (median hours) |
|---|---|---|---|
| January | 5.0 | 7.0 | 10.0 |
| February | 5.5 | 7.2 | 9.5 |
| March | 5.2 | 6.8 | 10.5 |
| April | 6.1 | 7.5 | 10.2 |
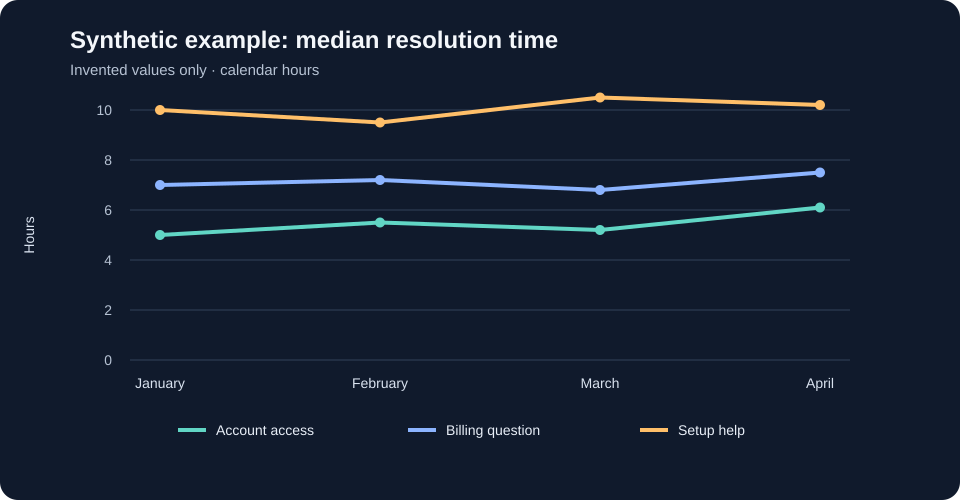
This chart plots the invented values above; it is an illustration of chart selection, not a report or measured result.
For these fictional medians, a line chart could show how categories change over time. A grouped bar chart may make month-to-month comparisons easier for readers who do not follow lines. A single stacked bar chart would be misleading for medians because medians are not additive parts of a total. The chart title should say “Synthetic example: median calendar hours to resolution,” and the axis should specify hours.
| Chart choice | Useful for | Common failure to check |
|---|---|---|
| Line chart | Ordered time periods and broad trends | Missing months may be connected as if data existed |
| Bar chart | Comparing discrete categories or periods | A truncated vertical axis can exaggerate small differences |
| Scatter plot | Looking for relationships between two measures | Correlation can be mistaken for causation |
| Histogram | Seeing a distribution and skew | Bins can change the apparent pattern |
| Box plot | Comparing spread and outliers between groups | Readers may not know what each line and box represents |
| Stacked chart | Showing additive totals or composition | Do not stack medians, averages, or unrelated measures |
The chart must be generated from the verified values, not from invented values supplied by the AI. Check that categories are in a consistent order, dates are chronological, missing periods are visible or explained, labels include units, and group sizes are available where needed. If the chart goes outside the team, consider whether rare categories could reveal a person or client.
Avoid smoothing a small dataset into a compelling trend. Avoid 3-D effects, dual axes without a strong reason, unlabeled percentages, and color-only distinctions that are inaccessible to some readers. Provide a table or text summary when a chart alone would hide exact values.
Step 14: Review the Output for Privacy and Fairness
Review outputs before sharing them, even if the prompt used only synthetic rows. A model may repeat content it received, add details from context, or produce a narrative that reveals a small group. The final document may also include comments, change history, hidden worksheets, or pasted prompt text.
Privacy review
- Remove names, account references, email addresses, and unusual case details from the report.
- Check whether a small group or rare category permits re-identification.
- Confirm that screenshots do not show customer records, user names, browser tabs, or internal URLs.
- Remove embedded prompts, uploaded-file links, and internal paths unless authorized.
- Check the report's recipients and sharing permissions.
- Retain or delete the working file according to the approved schedule.
Fairness and scope review
- Does a summary turn a group-level pattern into a judgment about an individual?
- Do categories encode sensitive traits or proxies for them?
- Are groups so small that a few cases dominate the result?
- Could unequal data quality make one group appear different?
- Does the model recommend a decision outside the task's stated purpose?
- Was the result reviewed by someone who understands the domain and can challenge it?
Do not use a model's polished tone as a trust signal. Read the values and definitions. If a chart or conclusion would be difficult to explain to the people represented in the data, that is a reason to pause and review the purpose, not just improve the prompt.
Step 15: Team Controls for Recurring Spreadsheet Work
For a one-time personal analysis, a checklist may be sufficient. For recurring business processes, write a lightweight standard that identifies roles and gates. The exact controls depend on the data and jurisdiction; this list is a starting point for a policy owner, not legal advice.
Define acceptable use
List data categories that may be used, data categories that require approval, prohibited uses, approved tools, and approved account types. Explicitly distinguish a consumer account from an organization-managed account. Include what to do when a person is unsure rather than relying on informal folklore.
Assign ownership
Name who owns the workbook, who approves the AI service, who prepares the minimized copy, who checks calculations, and who approves the final decision. A model should not be the accountable owner. Where possible, separate preparation from review for consequential work.
Scope permissions
Prefer file-level access over broad drive-wide access. Review connectors, plugins, browser extensions, and API keys. Remove stale access. Restrict who can invite others to a conversation or share a generated report.
Set retention and deletion rules
Define where source workbooks, working copies, prompts, outputs, and logs belong; how long each should be kept; and who can delete them. A “delete chat” button may not delete every service log or backup. Document the provider's actual retention behavior and align it with internal schedules.
Require review proportional to impact
Low-risk formula assistance may need a quick test. A recurring financial or operational report may need a second reviewer and reconciliation. A high-impact use may be prohibited or require formal validation, legal review, and documented human oversight. Keep the control proportional to what could go wrong.
Make incidents reportable
Give staff a simple path for reporting accidental uploads, exposure of credentials, unexpected connector access, or a wrong result already sent to decision-makers. Define who assesses the incident and when to notify security, privacy, legal, or affected parties. Do not tell employees to hide a mistake because they hope the provider deleted the chat.
Keep a tool inventory
Track approved service, account type, owner, data classes permitted, contract or policy reference, retention terms, connectors, and date last reviewed. Re-check after major product changes, new integrations, or policy updates. A tool can change its features and defaults after a team has adopted it.
Step 16: Common Mistakes and Better Alternatives
Mistake: “I removed the names, so it's anonymous.”
Why it fails: combinations of dates, locations, rare values, and narratives may still identify a person.
Better: minimize fields, generalize or suppress rare groups, generate synthetic rows, and use “pseudonymized” unless anonymity has been properly assessed.
Mistake: Uploading the original because the chatbot can read Excel.
Why it fails: hidden tabs, comments, pivot caches, external links, and metadata can travel with the file.
Better: make and inspect a new minimized export; use synthetic examples for formula support.
Mistake: Treating an opt-out toggle as a privacy guarantee.
Why it fails: training use, processing, retention, abuse monitoring, and deletion are different controls.
Better: check each applicable term and use an approved account.
Mistake: Asking for “all insights” or “what should we do?”
Why it fails: broad prompts increase unnecessary analysis and invite unsupported recommendations.
Better: ask one bounded question, define the decision, and state what the model must not infer.
Mistake: Pasting real rows to explain a formula.
Why it fails: formula syntax usually needs column types and a small shape, not real people or business values.
Better: invent a tiny dataset with edge cases.
Mistake: Assuming the answer's cited cells are real.
Why it fails: a language model can produce plausible but nonexistent sheet names and cell references.
Better: click or navigate to each cited cell in the spreadsheet and verify the value.
Mistake: Treating a chart as evidence that a result is correct.
Why it fails: a chart can faithfully visualize a wrong formula or filter.
Better: validate the table first, then check chart ranges, scale, labels, missing values, and denominator.
Mistake: Using AI to infer why a pattern happened.
Why it fails: the model can invent a causal story from descriptive data.
Better: label hypotheses, identify what extra evidence would test them, and avoid causal wording without a suitable study design.
Mistake: Publishing a small-group result without checking disclosure risk.
Why it fails: a chart can expose an individual's participation, condition, or outcome even if the source file is secure.
Better: aggregate, suppress or combine categories, and follow the applicable disclosure review.
Mistake: Thinking local means secure.
Why it fails: local apps can sync, connect to APIs, use extensions, or store unencrypted files.
Better: inspect the actual data flow, device controls, backups, and software approval.
A Reusable Pre-Upload Checklist
Before any spreadsheet content is sent to an AI system, be able to answer “yes” to the relevant checks:
Purpose and authority
- I can state the question and intended decision in one or two sentences.
- The AI is not being asked to make an unreviewed consequential decision about a person.
- The data owner and policy allow this use.
- Any contract, consent, regulation, or retention requirement has been considered.
Data minimization
- I tried a no-upload method first or confirmed why it is insufficient.
- I selected only the required columns and rows.
- Direct identifiers, credentials, unnecessary narratives, and sensitive details are absent.
- Hidden sheets, comments, metadata, filters, caches, links, and embedded content have been checked.
- Indirect identifiers and small-group disclosure risk have been considered.
- The shared version is a new working copy; the original remains protected.
Tool and account
- I am using the exact approved product, feature, and account.
- The current terms for training, retention, human access, deletion, and subprocessors are understood.
- Connected-app permissions are limited to what is needed.
- If using a local tool, I verified its actual data flow and device storage.
Analysis and review
- The prompt defines units, time periods, exclusions, missing values, and expected output.
- Formula or code output is tested against synthetic edge cases.
- Row counts, denominators, date handling, and category mappings reconcile.
- Results are reproduced independently for important uses.
- Claims are labeled as descriptive, predictive, or causal.
- Final charts and text do not reveal people or make unsupported claims.
If a required answer is “no” or “I don't know,” stop before uploading. Use a synthetic sample, seek approval, or complete the calculation in an authorized environment.
A One-Page Workflow to Reuse
- Frame: Write the purpose, question, population, metrics, groups, exclusions, output, and decision boundary.
- Classify: Identify the data subjects, sensitivity, potential impact, applicable commitments, and authority.
- Choose: Use ordinary spreadsheet features first; otherwise select synthetic, aggregate, approved hosted, or approved local analysis.
- Inspect: Review every sheet, row, column, comment, property, formula, cache, link, and connector relevant to the file.
- Minimize: Keep the necessary fields, generalize precision, remove narratives and identifiers, and document transformations.
- Test: Create synthetic rows that include blanks, duplicates, boundaries, unusual values, and known answers.
- Prompt: Ask a narrow question with units, assumptions, output format, and explicit limits.
- Reproduce: Run formulas or queries in the authorized environment and reconcile counts and denominators.
- Review: Check accuracy, disclosure risk, fairness, chart integrity, and the distinction between association and cause.
- Retain or delete: Follow documented retention, revoke unneeded permissions, and report any accidental disclosure through the proper channel.
When AI Is the Wrong Tool
Choose another method if the data owner has not authorized the disclosure, the provider terms are unclear, the workbook contains credentials or highly sensitive personal data, a plugin requests broader access than necessary, or the analysis would make an important decision about an individual without a validated and accountable process.
Also consider skipping AI when the task is simple. A COUNTIF, a pivot table, a filter, or a documented query may be faster and more transparent. AI is not a required step in a modern data workflow. Its value is in helping with an unfamiliar method, explaining a formula, or exploring a bounded pattern—not in replacing ownership, judgment, or validation.
If you need outside help but cannot share the real workbook, create an example with invented columns and values. You can ask for formula syntax, a validation plan, chart options, or a checklist without disclosing the underlying records. If the model still needs real rows to answer, revisit whether the question can be decomposed or run inside an approved environment.
References and Further Reading
These sources explain general privacy, risk-management, and provider-specific controls. Provider pages describe the provider's own commitments; they are not independent certification or legal advice. Re-check dates, account scope, and the exact service before relying on them.
- National Institute of Standards and Technology (NIST), Privacy Framework. A voluntary framework for identifying and managing privacy risk. NIST Privacy Framework
- NIST, Artificial Intelligence Risk Management Framework. A voluntary framework for managing risks associated with AI systems. NIST AI RMF overview and AI RMF 1.0 PDF
- NIST, Generative AI Profile (NIST AI 600-1). A companion resource describing generative-AI-specific risks and suggested risk-management actions. NIST AI RMF Generative AI Profile
- Information Commissioner's Office (ICO), Anonymisation. Guidance on anonymisation and the risk that people may be identified from data. Applicable law and interpretation differ by jurisdiction. ICO anonymisation guidance
- Google Workspace, Generative AI privacy hub. Google describes data handling and controls for its Workspace generative-AI offerings; scope depends on qualifying editions and the particular product. Google Workspace generative AI privacy hub
- Microsoft, Privacy FAQ for Microsoft 365 Copilot. Consult Microsoft's current documentation for the specific Copilot product and account; Microsoft 365 Copilot and consumer Copilot are distinct contexts. Microsoft 365 Copilot privacy FAQ
- OpenAI, Enterprise privacy. Provider information about business-product data handling; verify the specific product, contract, configuration, and current terms. OpenAI enterprise privacy
- Wikimedia Commons, “Ruler and laptop on a desk (Unsplash).” Hero photograph by Oli Dale (olidale), released under CC0 1.0. File page and license details
- Wikimedia Commons, “Simple budgeting spreadsheet eg.” Spreadsheet example by Smallbones, released under CC0 1.0. File page and license details
The first seven references are for concepts and provider-policy verification; the last two document the visual assets. This article is educational information, not legal, financial, security, or compliance advice. Follow the rules that apply to your data and organization.